Six Sigma aims to improve business, product, and process performance using quality methods and principles. In 1986, Motorola engineers Bill Smith and Mikel Harry developed this fantastic model. Sigma level indicates an estimation of defects per million opportunities. In six sigma, sigma (σ) is a greek letter that calculates the variability of the process. Due to growing customer expectations and the complexity of products, businesses are trying to reach 3.4 defects per million opportunities.
Let’s explore this concept in detail.
What is six sigma
The six sigma methodology uses tools and techniques that can be applied to a DMAIC performance improvement process.
- D (Define): Describe the objectives of the improvement.
- M (Measure): Measure the current procedure.
- A (Analyze): Determine how to reduce the gap between the current performance and the desired performance of the system or process.
- I (Improve): Enhance the approach.
- C (Control): Maintain the new technique.
It streamlines the design and operation of management and business processes that allow employees to delight customers. This works in the following way:
- Examining crucial elements of business or market
- Creating a tentative idea based on observations.
- Making predictions
- Evaluating predictions by thoroughly reviewing or performing an experiment.
- Documenting the results and modifying them accordingly with the thesis.
- Making use of statistical tools if there is variation.
- Performing the above steps again to remove any discrepancy between the final result and hypothesis.
All these aspects help organizations or businesses to be efficient. Additionally, these records also show glimpses of risks and problems associated with any specific process.
How to implement six sigma

Leadership
It forms a clear vision to drive the success of six sigma’s strategy. Moreover, the leadership is responsible for communicating this vision repeatedly within the organization. Their primary duties include:
- Checking whether six sigma goals align with the whole business
- Modifying the organizational structure to let individuals follow six sigma as a part of common practice.
- Designing new positions and departments
- Structuring rewards and recognition system
Leading representatives of the organization will receive training in the principles, tools, and philosophy of Six Sigma.
Infrastructure
Senior leaders lead the growth and training of an infrastructure to sustain and execute Six Sigma practices using their knowledge.
Communication
Organizational culture is moved forward with soft wiring to let creativity thrive. The top-level DMAIC project is concerned with change management and the communication necessary to build buy-in.
Feedback system
Stakeholder
A well-designed system is established for communication between employees, clients, and suppliers. This is done by applying rigorous methods of collecting and evaluating feedback from customers, owners, employees, and suppliers need to be developed. Several studies can specify the obstacles associated with policy, culture, and methods.
Process
Similarly, a process feedback system is also formed to measure the process’s success and identify the risks involved. This mainly focuses on key goals, strategies, and responsible drivers of the organization.
Project selection
Individuals with process knowledge at different levels of the organization suggest Six Sigma projects to enhance business operations. They are picked by senior leaders to fulfill objectives related to measurable economic outcomes.
Project development
Normally, Six Sigma projects are carried out by teams of black belts or green belts aided by black belts.
Comparison between the black belt and the green belt
| Black belt | Green belt |
| Active involvement in organizational change and development. | Active involvement in examining and resolving quality issues. |
| Mastery of various technical tools. | Mastery of all phases of DMAIC. |
| Training duration:3-6 weeks | Training duration: 10 days of classroom training. |
| Distribute roles and responsibilities within a team. | Communication with black belt individuals to review project progress and seek help. |
| Change agents in transformational projects. | Change agents for process improvement. |
| Lead cross-functional teams. | Work on the projects within the functional area. |
Read more on how to combine six sigma activities with information techniques.
Popular Six Sigma tools
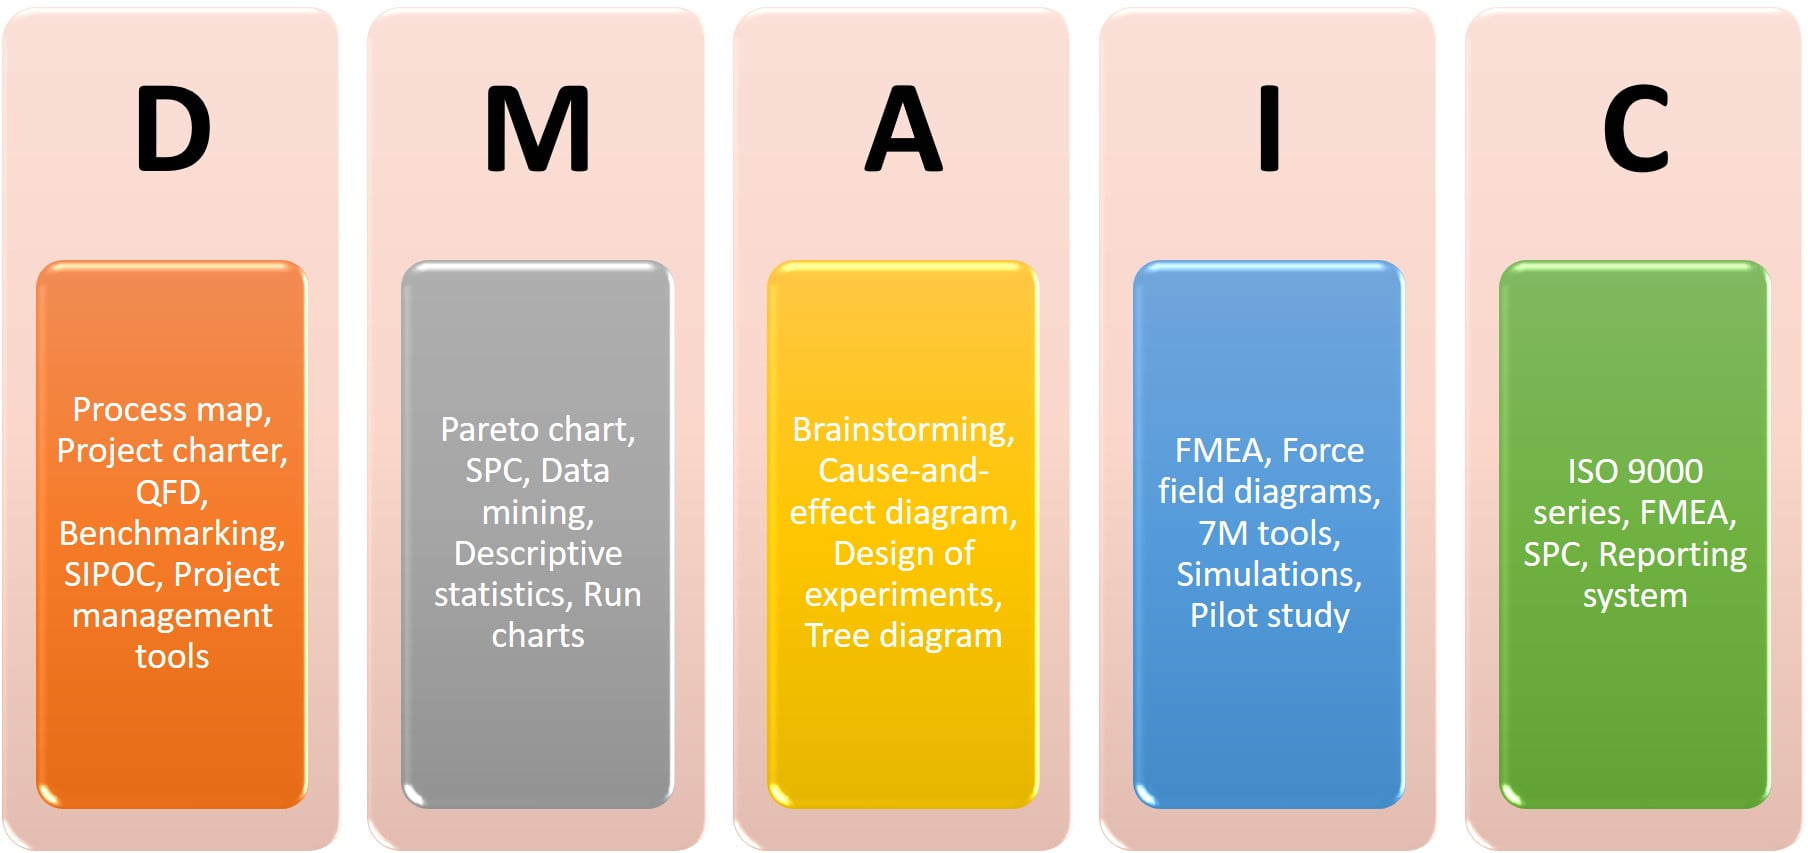
Below is the list of popular six sigma tools according to each phase of the DMAIC model.

Define
Process map
It specifies the task owners and details the typical timelines for each stage in a process. These are particularly useful for communicating process improvements among stakeholders.
Project charter
It is a brief document that comprises goals, requirements, stakeholders, constraints, milestones, communication, and deliverables.
QFD
Quality Function Deployment (QFD) specifies customer requirements and transforms them into detailed specifications to make the products accordingly. The purpose of QFD is to translate customer requirements into measurable design targets, then drive them down via subassemblies, parts, and production phases.
Benchmarking
It is a method of comparing one or more aspects of an organization’s operations against those of previously recognized leaders. The analysis gives important information about how your organization compares to alike companies, even if they serve a different market or have a distant customer base.
SIPOC
SIPOC (supplier, input, process, outputs, and customers) is a tool that lays out a plan for a business process from start to end before the execution.
Project management tools
This involves several tools like Gantt charts, network diagrams, work breakdown structure, project baseline, etc.
Measure
Pareto chart
It is a cause-analysis tool that investigates the frequency of issues or causes in a method. It is represented as a bar-line graph where the bar shows individual values while the lines show the cumulative total.
SPC
Statistical process control (SPC) is a tool that measure, monitor, and control the procedure using statistics.
Data mining
The goal of data mining is to find patterns and relationships in large data sets to tackle business challenges through data analysis.
Descriptive statistics
It is data that depict the basic characteristics of information in a study. Additionally, it evaluates those statistics.
Run charts
The purpose of a run chart is to determine trends or patterns in data collected over time. With a run chart, you can observe and notice trends, changes, and cycles.
Analyze
Brainstorming
A brainstorming session involves participants sharing ideas and knowledge to resolve a particular concern.
Cause-and-effect diagram
It is one of the seven quality tools, also known as the fishbone or Ishikawa diagram. It recognizes potential reasons for a problem or effect. This diagram is effective for root-cause analysis.
Read more, about the top 5 principles that define the Kanban System
Design of experiments
It is a branch of applied statistics that is concerned with the design, interpretation, and analysis of controlled experiments to investigate the aspects that determine the values of parameters.
Tree diagram
It represents the hierarchy of jobs and their sub-activities needed to accomplish an objective. It begins with a single item that branches into two or more items, which in turn split into two or more objects, and so on.
Improve
FMEA
A Failure Modes and Effects Analysis (FMEA) is an organized approach for pinpointing the types of potential failures and assessing their relative impacts. It also figures out the crucial elements of the process that need modification.
Force field diagrams
This tool also finds out the root cause and takes corrective action. Equilibrium is assumed to exist between all forces opposing and supporting the current state in any situation. Increasing the favorable forces and countering the negative forces will help to induce a change by reinforcing the positives and eliminating the negatives.
7M tools
This tool consists of:
- Affinity diagrams
- Interrelationship diagrams
- Tree diagrams
- Process decision program charts
- Matrix charts
- Prioritization matrices
- Activity network diagram
Refer to our article, 4 best strategies to implement lean manufacturing to learn about vital quality tools like poka yoke, 5S, etc.
Simulations
In the simulation, models are used to replicate real-world processes or systems. In simulations, the model is shown to change over time as a result of different conditions.
Control
ISO 9000 Series
The ISO 9000 series of international standards provide a framework for companies to document the quality system elements needed to maintain a high level of quality.
Reporting system
It refers to a wide range of applications that extract and classify data from databases and present these data as reports. Later, these are managed and distributed to business decision-makers for making critical decisions.
SPC and FMEA can also be used in this control phase for sustaining the six sigma philosophy.

[…] to our article on how to design Six Sigma model using 5 elements to understand various six sigma tools like the Fishbone diagram, project charter, process map, […]
[…] manufacturing, food, energy, medicine, semiconductor, etc. This standard is a crucial aspect of Six Sigma companies. Even though ISO sounds simple, it has a vast vocabulary that consists of different […]
[…] our article on how to design the Six Sigma model using 5 elements to streamline the […]
[…] shine, standardize, and sustain. It is the pillar of the traditional lean methodology used in the six sigma companies. Now, it can organize modern workplaces as […]
[…] six sigma activities calls for engaging with other information techniques like online analytic processing […]
[…] If you want to learn about six sigma tools, read how to design Six Sigma model using 5 elements. […]