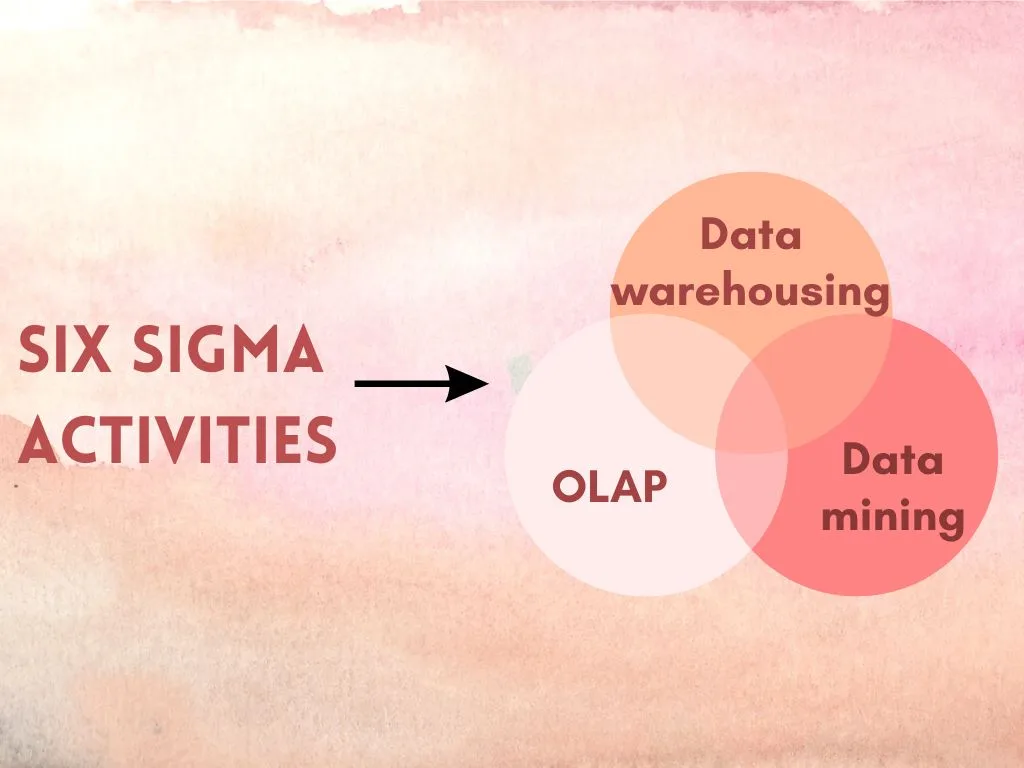
Executing six sigma activities calls for engaging with other information techniques like online analytic processing (OLAP), Data mining, and Data warehousing. In one of our previous articles, we discussed DMAIC elements and popular six sigma tools in detail. We will now study the connection between six sigma and other data methods.
Data warehousing is related to keeping and storing the crucial information that can be helpful in six sigma implementation. It stores the data the same as material warehousing. With OLAP, anyone can examine large databases, regardless of their technical ground. The goal of data mining is to analyze data subsequently using the latest tools and methods. Although big companies need cutting-edge data warehousing, OLAP, and data mining processes, smaller organizations can achieve much by executing suitable systems.
Six Sigma teams require long-term data management and analysis, which can’t be done with a spreadsheet or its multiplication. Database designs based on Microsoft Access or SQL Server back-ends provide tremendous benefits over spreadsheets, especially when paired with user interfaces to drill down into the database, or query associated databases, such as Laboratory Information Systems (LIMS) or Manufacturing Resource Planning (MRP) systems.
Data warehousing
It is a widely progressing field. William H. Inmon invented this concept. Data warehouses were almost absent in 1990. Nowadays, every company has a minimum of one data warehouse; while others have several. Software, hardware, and complete systems are all available from dozens of vendors in the data warehousing space. Its executions are as numerous as data warehouses, and few standards exist.

Recently, technological advancements and reductions in costs have made multitiered data warehousing an increasingly attractive option for corporate users. A multitiered data warehouse architecture assesses how the data is used within a company. For Six Sigma activity analyses, it is better to keep all the details in the warehouse for past analysis, despite access and storage considerations. Following is the list of its vital parts:
- A central repository that acts as the prime storage for the information
- Metadata defining the attributes of the data
- Data transport and cleansing that transfers data between multiple stores.
- End users
- Data marts that allow fast access to the end users within several applications.
- Operational feedback enables operational decision support to be integrated into the systems.
Each data warehouse comprises source systems and end users. The data is created in the source systems and passed to the end customers via multiple parts like hardware, software, and networks. It serves many benefits:
- Designs latest innovations and learnings
- Enhances business performance
- Transfers information to better support decision-making.
OLAP
Online analytical processing, or OLAP, is a collection of tools that assist regular users to extract valuable information from large databases. A data warehouse might or might not house these databases. In this case, the user benefits from knowing that the data has already been cleansed, which makes access more efficient. OLAP tools consist of client-server tools with graphical user interfaces that allow users to query data arranged in “cubes,” which can be sliced and diced in any way they wish.
In comparison with SQL queries on traditional relational databases, OLAP tools provide a faster response time when accessing large data warehouses. Cubes are the basis of OLAP which is composed of subcubes that summarize data from several databases. Multiple dimensions make up each cube in a database, representing different fields.
Data mining
It finds hidden patterns in the data by investigating and researching with automatic or semiautomatic standards. These uncovered patterns are crucial to designing performance rules in an innovative and creative way. When combined with six sigma, data mining can highly improve customer satisfaction rate, reduce cycle time, minimize expenses, and enhance quality. The goal of data mining is to generate questions through knowledge discovery and to test hypotheses through experiments.
Aspects of Six Sigma and data mining are similar when it comes to evaluating data, such as categorization, estimation, forecast, affinity grouping, clustering, and depiction. Data mining, on the other hand, uses a different set of tools than traditional Six Sigma tools, making it a viable alternative. It focuses primarily on marketing, sales, and customer service, while Six Sigma concentrates on internal business strategies. Six Sigma activities ultimately aim to improve customer satisfaction, so data mining delivers both feed-forward and feedback information about its accomplishment. It is a valuable tool to analyze business data. Refer to the below stages:
Goal specification
Specify the purpose of a data mining project. Its purpose should link with the particular business affair like making or retaining customers, total fuel/energy utilization in a process, etc. This stage also determines the effect of discovered pattern on the business improvement.
Data selection
This step pinpoints the required data and its sources for the successful execution of data mining.
Data preparation
This involves cleansing and combining data, as well as adding new columns (fields) to the data by aggregating, calculating, and manipulating existing fields. In most cases, the outcome will be a flat table ready for data mining to take place (i.e., algorithms for discovering patterns). The data set for a table like this is generally divided into two parts: one for learning patterns, and the other for verifying them.
Data exploration
It examines the prepared data before the pattern discovery. It also reevaluates the results by the means of statistics values (min, max, avg, etc.) and the distribution of frequency of particular data fields. While data exploring, it’s possible to know the relationship between fields with the help of scatter plots.
Uncovering pattern
Here, pattern discovery algorithms do the trick of finding patterns. Using a discovery algorithm helps the pattern discovery process be most effective when applied as an exploration process. The discovery process can be interacted with and enhanced by business users. If users create a classification tree, for example, they can examine/explore the filtering of data to that path at any point during the tree construction process, examine how the algorithm recommends the next data field for the branch, and use their business judgment to select the next data field. During the pattern discovery stage, we also evaluate whether we can predict the occurrence of the event using data besides those used to construct the model.
Deployment of pattern
The discovered patterns help to fulfill the business objective of data mining.
Pattern presentation
It’s a graphical tree display along with data statistics.
Business intelligence
Reports based on business intelligence patterns are derived from queries against a database.
Data scoring and labeling
Every record in the database is scored or labeled with the propensity and the label of the pattern that corresponds to the data record.
Decision support systems
The uncovered patterns form the vital parts of the decision-support process.
Alarm monitoring
An organization uses the patterns discovered to establish norms for its business processes. Detecting deviations from normal conditions at the earliest possible stage can be accomplished by monitoring these patterns. It may be possible to accomplish this by integrating the data mining tool as a monitoring component, or by using a classical approach, such as control charts.
Pattern validity monitoring
Pattern validity will decline with the changing business processes. Patterns can then be observed by noticing these changes as soon as possible. In case of substantial changes, there will be a need of discovering new patterns by scrutinizing the latest data.
Read more, 4 critical applications of big data analytics.
The relationship between six sigma, OLAP, and data mining
Data mining cannot replace OLAP. When it comes to reporting on data, OLAP tools are effective tools, while data mining focuses on discovering hidden patterns within the data. A data-driven approach to OLAP allows users to quickly confirm or deny hypotheses based on existing theories. In essence, it is a semiautomated analysis method. Six Sigma activities techniques are complementary to OLAP and data mining. For retrospective studies, both OLAP and data mining are used: both generate hypotheses based on the analysis of past data. Conversely, designed experiments allow users to design prospective studies: they test the hypotheses developed by OLAP and data mining. When used together, Six Sigma, data mining, and OLAP provide a powerful toolset for enhancing business processes.

[…] Read more on how to combine six sigma activities with information techniques. […]
[…] Also read, how to combine Six Sigma activities with information techniques. […]
[…] to our article on how to combine Six Sigma activities with information techniques to learn about the successful execution of six […]