Big data is an enormous volume of datasets that has caught everyone’s attention in this digital age. It is a large pile of tedious information generated from various fields like the internet, phones, banks, emails, etc. These datasets exist as unstructured, semistructured, or structured and cannot be stored using traditional data processing.
Let’s understand this concept in detail.
What is big data
The amount of data created each day is approximately 2.5 quintillion bytes. Also, each dataset consists of a few dozen terabytes to petabytes of data. This massive data is complex to capture, store, investigate and envision. Nowadays, businesses and industries are exploring opportunities to deal with this big data. As generally discussed, three v’s are featuring big data:
- Velocity: the pace at which the new data is generated or revised. Examples include streaming data from websites. Twitter, for example, induces 500 million tweets every day.
- Volume: the size of the data. Sources like E-commerce, social media, and smartphones are responsible for the large volume of data.
- Variety: various kinds of data and different data analysis methods.
The most challenging part is to categorize it for big data analytics. Different data forms are listed below:
- Data from video, audio, and other gadgets.
- Multi-dimensional data obtained from warehouses
- Unstructured data such as text or human language
- Semi-structured like RSS or XML
The data quality can also vary due to obscurity, incompatibility, inadequacy, etc.

Big data analytics
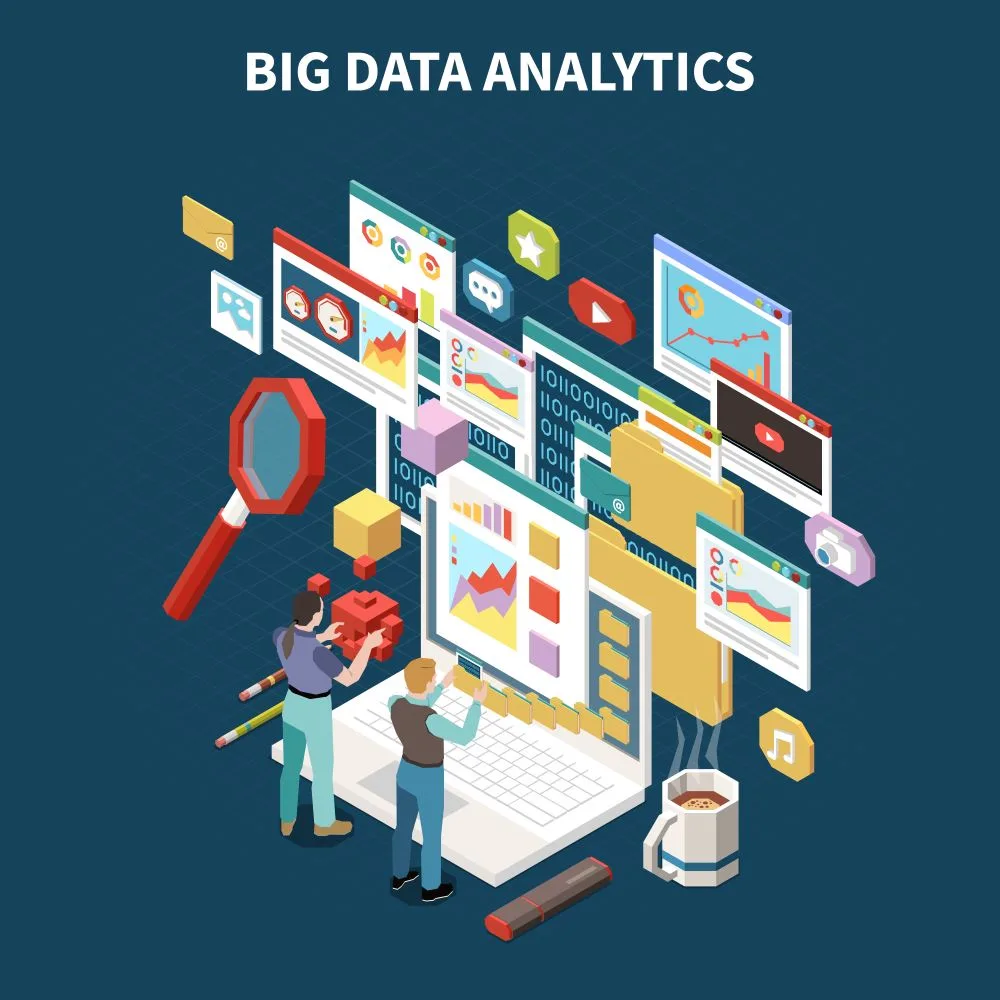
Big data analytics aims to find hidden patterns, important meanings, relationships, etc., from the data for better decision-making. Thus, this analysis plays a crucial role in research and development. Consider social media analytics. Millions and trillions of data are generated on the social networking sites like Twitter, Facebook, etc. Social media analytics involves designing and assessing information structures and means for organizing, monitoring, outlining, studying, and visualizing data. Furthermore, it helps to understand how people react and converse in online communities. Additionally, it interprets their exchanges and what they share on social media to learn useful patterns and intelligence.

Such analytics is greatly beneficial to organizations. It drives decision-making, designing, conceptualization, and implementation.
If you want to learn about the business models of Google and Facebook, refer to our article, top 3 business models to watch out for.
Supply chain management
In supply chain management, big data analytics achieves the following:
- Predicts shifts in demand
- Identifies stock utilizations
- Minimizes lead time and avoids delays and interventions
- Helps to monitor the performance
- Facilitates decision-making to change the supplier according to the cost or quality competitiveness
- Enhances profit margins
- Reduces inventories
- An overall increase in department efficiencies
- Develops planning, forecasting, servicing, and transparency
Read more, 4 best strategies to implement lean manufacturing.
Quality improvement
Big data can accomplish the following objectives in the manufacturing, energy, and telecommunication sectors that focus on quality management and improvement.
- Enhances the product and services quality
- Drives profits
- Reduces scrap rates thereby reducing the time to market
- Real-time data assessment improves decision-making for quality management.
- Increased efficiency
- The medical field can keep a track of patients’ treatments and routine body checkup data. These records can be analyzed to improve the quality of health records.
- The data extracted from sensors fitted on roads give real-time data on traffic updates, road disruptions, accidents, etc. Intelligent vehicles like Self-driving cars can provide numerous datasets generated from installed sensors.
- With the integration of IoT and smart cities, data from localities, hospitals, banks, governments, networks, climate, etc., can become available within a fraction of a second.
Refer to our article about the 15 most valuable terms to understand ISO 9001:2015 to know the industrial quality requirements.
Customer insights
This particular field is highly advantageous for marketing, retail, banking, etc. Big data analytics can do wonders like:
- Classifying customers according to the customer satisfaction index
- Providing appropriate data to stakeholders
- Dividing customer datasets with several filters to make informed decisions
- Doing competitor analysis
- Informing companies about the customer feedback
- Promoting advertising and driving marketing campaigns
- Growing profitability by understanding customer behavioral patterns
Threat detection and control
Big data analytics can detect scams and control risks.
- Recognizes risk exposure
- Provides an extensive picture of various risks to decision-makers so that they can mitigate risks
- Organizations can combine cybersecurity and data tools to protect themselves against digital attacks.
- Determines and prevents the occurrence of fraud
- Teaches systems about new types of fraud and adjust their behavior accordingly.
- Through the use of big data tools and techniques, fraud can be prevented and recovered more quickly by identifying and detecting compliance patterns effectively in all available data sets.
Big data processing tools
Apache Mahout
This is a commercial and scalable machine-learning algorithm implemented by Google, Facebook, Yahoo, Twitter, and IBM. It implements algorithms such as clustering, classification, pattern mining, regression, dimensionality reduction, evolutionary algorithms, and batch-based collaborative filtering using the map-reduce framework on top of the Hadoop platform. Mahout’s goal is to foster a diverse, vibrant, and responsive community to discuss the project and its potential uses.
Dryad
This programming model executes parallel and distributed programs to manage large context bases on dataflow graphs. There are thousands of Dryad users, each of whom uses multiple machines with multiple processors. The Dryad application runs on a set of vertices and channels that make up a computationally directed graph. In this way, Dryad automates the process of generating a job graph, scheduling machines for available processes, gathering performance metrics, visualizing it, and executing user-defined policies dynamically.
Splunk
With Splunk, you can combine the latest cloud technologies with big data. Machine-generated data can be viewed, searched, and analyzed using the web interface. Graphs, reports, and alerts illustrate results clearly and concisely. A few of its unique features include indexing structured and unstructured data, real-time-search, reporting, and dashing. It provides metrics for a wide range of applications, diagnose the system and IT, infrastructure problems, and intelligently supports business operations.
A few big data best practices comprise:
- Enhance skills with standardization modules and IT governance program
- Develop knowledge by sharing learnings
- Identify and arrange business objectives with big data
- Understand vital business gaps
- Make meaningful discoveries by integrating different types of data


[…] the name suggests, big data is a huge portion of structured, unstructured, and semistructured information that is hard to […]
[…] Read more, 4 critical applications of big data analytics. […]
[…] process implementation such as AI, Machine-learning, Augmented reality, Big data, […]